| English | 简体中文 | |||||||||
|
|||||||||
| Home | Product | Download | Support | Literature | Purchase | About Us | |||||||||
|
|
|||||||||
The modal testing experiment presented here is performed using ModalVIEW software and National Instruments DSA hardware as the modal testing and analysis tool. When the rotating machine is running, its vibration harmonics can be regarded as sweep excitation with a broad band spectrum, as the following figure shows. The measured vibration signals are the response to broad band excitation, which contains resonance information of the machine structure. During run-up or run-down testing of rotating machine, order tracking based operational modal analysis can be used to extract modal parameters from measured vibration response of the rotating machine in its operating condition.
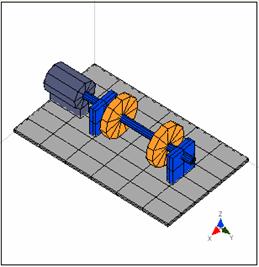
Experiment scenario
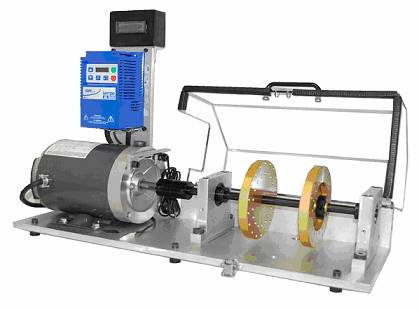
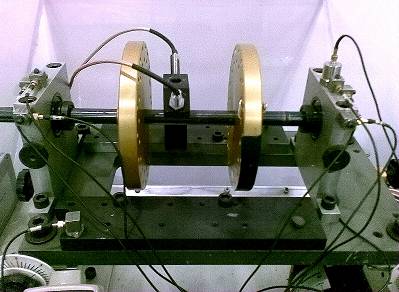
The structure vibration responses are measured from a group of accelerometers fixed on bearing support and machine base, respectively. Three accelerometers are fixed in horizontal, vertical and axial directions to measure vibration responses of the bearing support. A laser tachometer is used to obtain rotational speed of the machine, as the following figure shows. The signals from accelerometers and tachometer are acquired simultaneously using National Instruments PXI 1042Q chassis and two 24-bit PXI module NI -4472.
The rotating speed of the machine is changed from low to high in linearity. At the same time, vibration signals and tacho signal are measured simultaneously with sampling rate being 1kHz. The duration is 24 second, as the following figure shows.
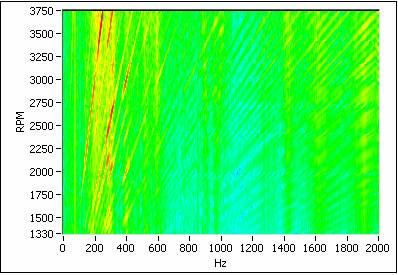
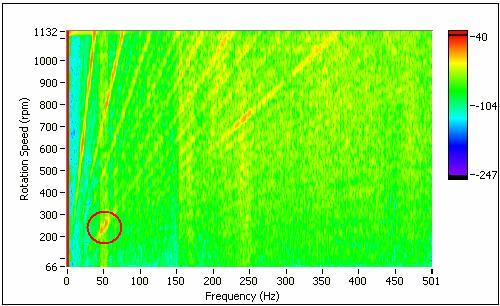
The order spectral map of vibration responses from rotating machine is shown as the following figure. The position marked by red circle on the spectral map indicates the zone related to structure resonance.
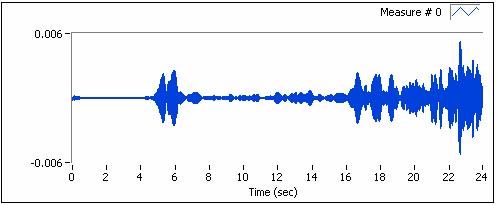
The specific vibration response to a single order is tracked from the overall vibration signal, as the following figure shows.
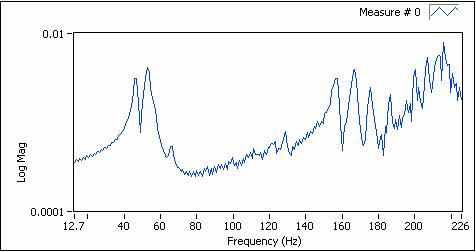
The order-tracked vibration signal is further converted into ODS FRF (modified cross-power spectrum) for modal parameter extraction, as the following figure shows.
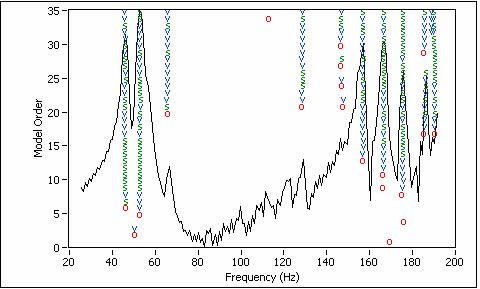
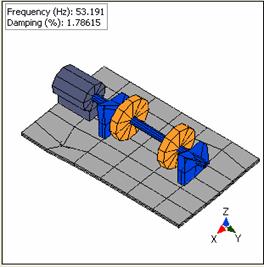
Gabor transform based order-tracking method and use the least squares complex frequency domain (LSCF) to process generated ODS FRF. Modal analysis for the structure is finished with ModalVIEW’s advanced mode estimation method based on mode stabilization diagram. The following figure shows the clear mode stabilization diagram from 8 measured FRF data. Part of the picked meaningful modes are listed in following table: Damping (%) 46.3459 1.54028 53.1975 1.76153 65.9842 0.969631 157.28 0.412013 166.782 0.452668 175.863 0.519221 186.585 0.121619 One of the mode shapes is
displayed as following
: Conclusion Vibration excitation caused by mechanical rotation can be viewed sweep excitation signal in a broadband frequency range. Correspondingly, the structural vibration response spectrum is also a broad band, which can be used for operational modal analysis for rotating machinery. The combination of Gabor transform based order-tracking method and the least squares complex frequency domain (LSCF) method is effective for rotating machine operational modal analysis.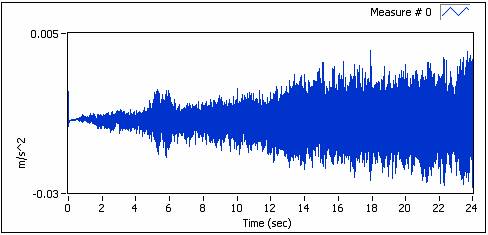
![]() Download this application note in
PDF format
Download this application note in
PDF format