| English | 简体中文 | |||||||||
|
|||||||||
| Home | Product | Download | Support | Literature | Purchase | About Us | |||||||||
|
|
|||||||||
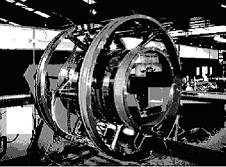
The
modal testing experiment presented here is performed by one branch of SIEMENS
Medical using ModalVIEW software and National Instruments DSA hardware as the
modal testing and analysis tool. The
analysis result provides instructive guidance on the design of their products.
|
|
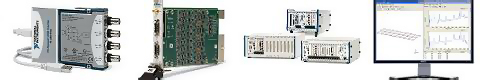
System configuration
In this modal testing experiment,
the following software and hardware are used:
1.ModalVIEW1.0
Software.
2.NI
DSA System (Low noise chassis PXI-1042,
Dual-core controller PXI-8106, 16
channel DSA module PXI-4498)
3.Hammer
(Lance LC1302) and
Charge amplifier (Lance LC0106).
4.Tri-axial
accelerometer (Kistler 8690C50).
Modal analysis for the structure
is finished with ModalVIEW’s advanced mode estimation
method based on mode stabilization diagram。The following figure shows the clear mode
stabilization diagram from 48*3 measured FRF data.
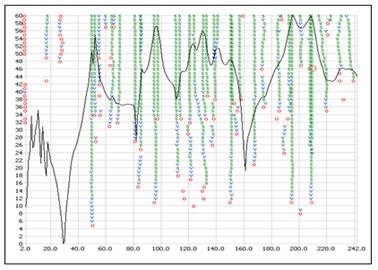
The closely spaced modes can be
selected from stabilization diagram. The real modes are kept with mathematical
or faked modes being discarded. Part of the picked meaningful modes are listed
in following table
|
Index |
Frequency
(Hz) |
Damping
(%) |
|
1 |
50.199 |
0.776 |
|
2 |
52.278 |
0.756 |
|
3 |
64.991 |
1.162 |
|
4 |
69.589 |
1.753 |
|
5 |
81.546 |
0.884 |
|
6 |
86.970 |
1.053 |
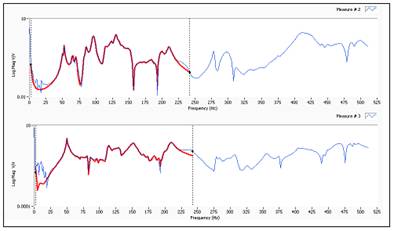
The
following figure displays the plot of synthesized FRFs
from estimated modes (red line) and measured original FRFs.
The synthesized FRFs should match original FRFs
well, which indicates that estimated modes are accurate enough.
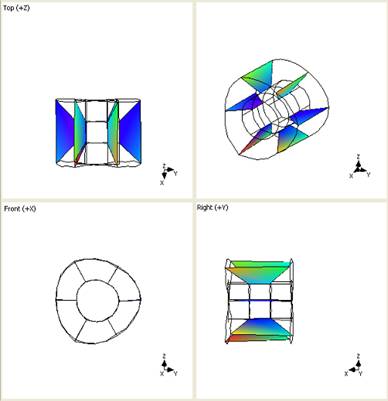
One of the mode shapes is
displayed as following
![]() Download this application note in
PDF format
Download this application note in
PDF format